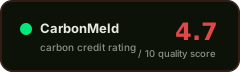
Aqua Clara Water Filtration Program in Kenya
GS-59 ↗ · current registry ID: GS1078
#754of 1329 in Industrial#87of 157 in Kenya#1133of 1801 in Gold Standard (GS)
Audit Analysis
The Aqua Clara water filtration project in Kenya has a verified additionality assessment and FPIC, but suffers from significant integrity gaps including no buffer pool, unaddressed reversal risk, a 0% leakage deduction with contradictory justification, and a history of over-issuance requiring credit deductions. Multiple ERR and methodology contradictions across verification cycles, combined with a project-specific baseline and CORSIA eligibility, elevate over-crediting and double-claim risk. The project's documentation is reasonably extensive (19 documents) but carries medium extraction confidence and several unresolved forward action requests.
Red Flags
- No buffer pool or permanence mechanism identified in any available document; reversal events explicitly 'not addressed' despite confirmed filter non-operation periods of 93 and 54 days
- Over-issuance of 176.14 credits (107.76 + 68.38) deducted in the 2022 verification report, indicating prior periods over-credited relative to actual filter usage
- 0% leakage deduction with contradictory justification ('quantified' in 2022 report vs 'deemed negligible' in 2021 report) for a project distributing physical filters to dispersed households
- ERR discrepancy of 4,432 credits between the 2021 monitoring report (28,429) and the 2022 verification report (23,997), a 15.6% reduction not fully explained by the stated over-issuance deductions
- CORSIA eligibility confirmed while CCP status is not stated, creating potential dual-channel crediting risk
Credit Vintages
| Issued | Retired | Available | ||
|---|---|---|---|---|
| 2011 | 67 | 67 | 0 | |
| 2012 | 9,373 | 9,373 | 0 | |
| 2013 | 13,809 | 13,809 | 0 | |
| 2014 | 18,144 | 18,144 | 0 | |
| 2015 | 23,191 | 23,191 | 0 | |
| 2016 | 25,733 | 25,733 | 0 | |
| 2017 | 31,976 | 31,976 | 0 | |
| 2018 | 41,913 | 41,913 | 0 | |
| 2019 | 19,972 | 19,971 | 1 | |
| 2020 | 27,120 | 27,120 | 0 | |
| 2021 | 31,420 | 30,919 | 501 | |
| Total | 242,718 | 242,216 | 502 |
Risk Indicators
Combined test, VVB-verified
mixed evidence / unresolved risk
0% deduction, contradictory justification
Project-specific, reassessed 2015
FPIC, grievance, benefit sharing
CORSIA-eligible, CCP not stated
⚑ Dispute this rating
Are you the project owner?
Metadata correction (free)
Name, country, marketplace or links incorrect? Let us know.
Does not modify the score.
[email protected] →Pipeline re-run with new documents
Have updated documentation not yet included? You can request a new run of the pipeline with the new inputs.
Submit Documents →Share this rating