Energy Efficient Cook Stoves for Siaya Communities, Kenya
GS-1243 ↗ · current registry ID: GS879
#432of 1329 in Industrial#51of 157 in Kenya#691of 1801 in Gold Standard (GS)
Audit Analysis
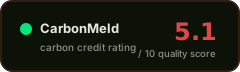
A Gold Standard cook-stove project in Kenya with a sound core design (VVB-confirmed additionality, measured baseline, FPIC and grievance mechanisms in place) but undermined by an unusually high volume of material findings, multiple corrective action requests, and data-quality inconsistencies across monitoring and verification documents. The project over-delivered relative to its pro-rata ex-ante expectation, yet the absence of a buffer pool, unaddressed reversal risk, and a 0% leakage deduction leave meaningful permanence and leakage gaps.
Red Flags
- At least nine corrective action requests and one formal action request were raised across verification cycles, covering date inconsistencies, a 6% overestimation of the project-technology-days parameter, data-transfer errors from questionnaires to the database, and missing calibration records for field-testing equipment.
- No buffer pool is recorded and the 2026 verification report states reversal events were 'not addressed,' leaving the cook-stove project exposed to stove-replacement risk without a quantified safety margin.
- The PDD proposed a 5% leakage deduction, but the 2024 verification applied 0% on the basis that leakage was 'deemed negligible'—a shift that was not independently re-justified in the later document.
- The 2026 verification report and the 2026 monitoring report disagree on the FNRB value (92 vs 0.92) and the FNRB method (national default vs local field data in the 2022 verification), creating ambiguity about which emission factor underpins the credit calculation.
Credit Vintages
| Issued | Retired | Available | ||
|---|---|---|---|---|
| 2011 | 5,029 | 5,029 | 0 | |
| 2012 | 15,398 | 15,398 | 0 | |
| 2013 | 27,285 | 27,285 | 0 | |
| 2014 | 36,312 | 36,312 | 0 | |
| 2015 | 59,274 | 59,274 | 0 | |
| 2016 | 87,353 | 87,353 | 0 | |
| 2017 | 109,698 | 109,698 | 0 | |
| 2018 | 130,673 | 130,631 | 42 | |
| 2019 | 145,500 | 137,494 | 8,006 | |
| 2020 | 162,894 | 162,894 | 0 | |
| 2021 | 183,549 | 180,142 | 3,407 | |
| 2022 | 238,699 | 194,738 | 43,961 | |
| 2023 | 289,372 | 275,026 | 14,346 | |
| 2024 | 306,908 | 0 | 306,908 | |
| Total | 1,797,944 | 1,421,274 | 376,670 |
Risk Indicators
VVB-confirmed combined test
reversal not addressed in 2026 verification
0% deduction; PDD originally proposed 5%
Project-specific, measured; last reassessed 2017
FPIC, grievance mechanism, benefit sharing documented
CORSIA and CCP status not stated
⚑ Dispute this rating
Are you the project owner?
Metadata correction (free)
Name, country, marketplace or links incorrect? Let us know.
Does not modify the score.
[email protected] →Pipeline re-run with new documents
Have updated documentation not yet included? You can request a new run of the pipeline with the new inputs.
Submit Documents →Share this rating