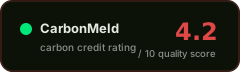
GS834 Improved Cooking Stoves for Nigeria Programme of Activities
GS-1215 ↗ · current registry ID: GS834
#1080of 1329 in Industrial#68of 79 in Nigeria#1522of 1801 in Gold Standard (GS)#160of 189 in AMS-II.G
Audit Analysis
This Gold Standard improved cooking stove project in Nigeria has a verified additionality assessment and a quantified 5% leakage deduction, but is undermined by five material findings in the validation report, a project-specific baseline with no documented reassessment, no buffer pool, and a significant discrepancy between the lifetime ex-ante estimate (89,123 tCO₂e) and a per-period claimed figure (8,912 tCO₂e) that cannot be fully reconciled from the available documents. The absence of any verified monitoring figure, usage-rate data, or life-cycle assessment further limits confidence in the claimed reductions.
Red Flags
- Five material findings in the 2011 validation report, including inconsistencies between the PoA-DD, generic CPA-DD, and case-specific CPA-DD, and an emission-reduction calculation that required adaptation after closure of other findings
- No buffer pool or permanence mechanism is documented for this energy-efficiency project, and reversal events are explicitly not addressed
- The claimed ERR of 8,912 tCO₂e (2012 document) and the lifetime ex-ante estimate of 89,123 tCO₂e (validation report, 2011) are flagged as contradictory; while the ratio is consistent with a 10-year crediting period, no monitoring report with a verified figure is available to confirm actual delivery
- No verified usage rate, no end-use tracking, and no life-cycle assessment are present in the extracted record, leaving the functional benefit and net reduction claims unverified
Credit Vintages
| Issued | Retired | Available | ||
|---|---|---|---|---|
| 2011 | 517 | 0 | 517 | |
| 2012 | 5,912 | 0 | 5,912 | |
| 2013 | 16,244 | 0 | 16,244 | |
| 2014 | 26,509 | 0 | 26,509 | |
| 2015 | 28,491 | 0 | 28,491 | |
| 2016 | 31,272 | 0 | 31,272 | |
| 2017 | 27,472 | 0 | 27,472 | |
| 2018 | 25,327 | 0 | 25,327 | |
| 2019 | 26,995 | 0 | 26,995 | |
| 2020 | 23,826 | 0 | 23,826 | |
| 2021 | 21,236 | 20,553 | 683 | |
| 2022 | 12,178 | 10,756 | 1,422 | |
| 2023 | 2,475 | 2,475 | 0 | |
| Total | 248,454 | 33,784 | 214,670 |
Risk Indicators
VVB-confirmed combined test
reversals not addressed
5% quantified deduction
Project-specific; no reassessment documented
FPIC, grievance mechanism, benefit sharing documented
CORSIA and CCP status not stated
⚑ Dispute this rating
Are you the project owner?
Metadata correction (free)
Name, country, marketplace or links incorrect? Let us know.
Does not modify the score.
[email protected] →Pipeline re-run with new documents
Have updated documentation not yet included? You can request a new run of the pipeline with the new inputs.
Submit Documents →Share this rating