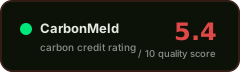
Methane Recovery Project Houbensteyn Ysselsteyn, Limburg, The Netherlands
#4of 7 in Netherlands#475of 1339 in Verra (VCS)#12of 72 in AMS-II.I
Audit Analysis
A long-running Dutch methane recovery project with VVB-confirmed additionality and a 0.5 conservativity factor, but undermined by five material findings that rely on estimation rather than direct measurement, a 0% leakage deduction that is difficult to justify for a biogas project, and eleven contradictions across its document set. The project delivered essentially 100% of its claimed reductions for the 2022 monitoring period, but the sharp drop from 58,034 tCO₂e in the prior period to 15,201 tCO₂e raises questions about the stability and reliability of the underlying data.
Red Flags
- Five material findings in the 2025 verification report indicate that biogas flow, methane content, manure quantities, and fossil-fuel replacement are all estimated or calculated indirectly rather than measured directly, with a flow-meter issue explicitly cited.
- Leakage deduction is 0% with a 'quantified' justification, yet no quantified leakage figure is provided in the extracted record; a 0.1% figure appears in the contemporaneous monitoring report, creating an inconsistency.
- The verified ERR dropped from 58,034 tCO₂e (2023 verification report) to 15,201 tCO₂e (2024 verification report), a 74% decline between consecutive periods, without a clear explanation in the extracted data.
- The additionality test type is recorded as 'barrier' in the 2007 validation report but 'regulatory' in the 2022 PDD, a fundamental discrepancy that is not reconciled in the available documents.
Credit Vintages
| Issued | Retired | Available | ||
|---|---|---|---|---|
| 2006 | 13,850 | 11,490 | 2,360 | |
| 2010 | 8,614 | 8,614 | 0 | |
| 2011 | 19,864 | 19,864 | 0 | |
| 2012 | 22,690 | 22,690 | 0 | |
| 2013 | 21,789 | 21,789 | 0 | |
| 2014 | 21,268 | 21,268 | 0 | |
| 2015 | 21,484 | 21,484 | 0 | |
| 2016 | 10,936 | 9,904 | 1,032 | |
| 2017 | 8,930 | 3,350 | 5,580 | |
| 2018 | 7,098 | 5,799 | 1,299 | |
| 2019 | 13,850 | 1,611 | 12,239 | |
| 2020 | 12,038 | 2,288 | 9,750 | |
| 2021 | 10,688 | 2,031 | 8,657 | |
| 2022 | 15,201 | 500 | 14,701 | |
| Total | 208,300 | 152,682 | 55,618 |
Risk Indicators
VVB-confirmed but test type contradicted (barrier vs regulatory)
mixed evidence / unresolved risk
0% deduction with 'quantified' justification but no figure provided; 0.1% in monitoring report
Project-specific, modeled, last reassessed 2022; not jurisdictional
FPIC conducted, grievance mechanism present, safeguards documented (per 2024–2025 reports)
Not CORSIA-eligible; CCP status not stated in available documents
⚑ Dispute this rating
Are you the project owner?
Metadata correction (free)
Name, country, marketplace or links incorrect? Let us know.
Does not modify the score.
[email protected] →Pipeline re-run with new documents
Have updated documentation not yet included? You can request a new run of the pipeline with the new inputs.
Submit Documents →Share this rating