Paradigm Healthy Cookstove and Water Treatment Project
GS-1280 ↗ · current registry ID: GS966
#1028of 1329 in Industrial#131of 157 in Kenya#1467of 1801 in Gold Standard (GS)
Audit Analysis
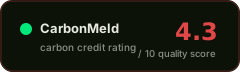
The Paradigm Healthy Cookstove and Water Treatment Project has confirmed additionality and basic safeguards in place, but is undermined by a 0% leakage deduction despite documented space-heating concerns, a 100% usage assumption versus a 64% verified rate, a non-conservative NRB value, and over 30 corrective actions indicating systemic monitoring and data-quality weaknesses. The project delivered roughly 116% of its pro-rata ex-ante expectation for the monitored year, so over-crediting is modest, but the underlying assumptions carry meaningful risk.
Red Flags
- Usage rate assumed at 100% in the PDD but verified at only 64.06% in the 2015 monitoring report — a 36-percentage-point gap that inflates baseline emissions avoided.
- Leakage deduction of 0% despite material findings identifying space-heating use of stoves in the wet season and potential NRB-fraction leakage for water treatment; the verification report (2014) labels leakage as 'quantified' while the 2013 monitoring report calls it 'deemed negligible.'
- NRB value of 0.94 (CDM methodology) is materially less conservative than the 0.65 used in comparable Gold Standard Kenya projects, and Gold Standard acceptance of the CDM-based calculation was still pending at verification.
- Over 30 corrective actions were required across verification cycles, including missing quarterly cross-checks, incomplete water-quality testing, surveyor data-entry errors, and inconsistencies between the monitoring report and PDD on emission factors and cluster definitions.
- FNRB value contradicts between documents: 82.14 (national default, verification report 2011) versus 92.0 (local field, monitoring report 2017), and the method itself is inconsistent (national_default vs local_field).
Credit Vintages
| Issued | Retired | Available | ||
|---|---|---|---|---|
| 2010 | 1,507 | 1,507 | 0 | |
| 2011 | 44,121 | 44,063 | 58 | |
| 2012 | 173,130 | 173,130 | 0 | |
| 2013 | 231,486 | 231,270 | 216 | |
| 2014 | 342,843 | 342,843 | 0 | |
| 2015 | 552,967 | 548,146 | 4,821 | |
| 2016 | 230,956 | 229,511 | 1,445 | |
| Total | 1,577,010 | 1,570,470 | 6,540 |
Risk Indicators
VVB-confirmed combined test
mixed evidence / unresolved risk
0% deduction with unresolved space-heating concerns
Project-specific baseline; reassessment date not stated
FPIC, grievance mechanism, benefit sharing documented
CORSIA and CCP status not stated
⚑ Dispute this rating
Are you the project owner?
Metadata correction (free)
Name, country, marketplace or links incorrect? Let us know.
Does not modify the score.
[email protected] →Pipeline re-run with new documents
Have updated documentation not yet included? You can request a new run of the pipeline with the new inputs.
Submit Documents →Share this rating