Adilabad biogas project
GS-1734 ↗ · current registry ID: GS6395
#154of 268 in Biogas#720of 975 in India#1216of 1801 in Gold Standard (GS)
Audit Analysis
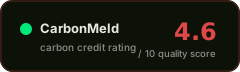
The Adilabad biogas project has a VVB-verified additionality assessment and a measured project-specific baseline, but the record is undermined by eleven cross-document contradictions, a missing verified ERR figure, and a striking discrepancy between the PDD lifetime estimate (63,961 tCO₂e over five years) and the single-year monitoring claim (72,685 tCO₂e), which represents roughly 568 % of the pro-rata expectation. The 95 % leakage deduction is extremely conservative yet contradicted by a 0 % figure in an earlier verification report, and no buffer pool is documented. Overall the project shows moderate integrity but significant data-reliability and over-crediting concerns.
Red Flags
- The 2025 monitoring report claims 72,685 tCO₂e for the 2024 period while the PDD (2024) states a lifetime estimate of 63,961 tCO₂e for the full 2024–2028 crediting period; the one-year claim is approximately 568 % of the pro-rata expectation (12,792 tCO₂e), indicating a potential over-crediting issue.
- Leakage deduction jumps from 0 % in the February 2025 verification report to 95 % in the December 2025 verification report with no documented methodological change, raising questions about data reliability.
- The December 2025 verification report marks reversal events as 'not addressed' while the November 2025 monitoring report states 'none reported'; the higher-priority verification document does not confirm the absence of reversals.
- Eleven contradictions across the document set (leakage, ERR, usage rate, additionality test type, FPIC, FNRB method, reversal events, crediting period, monitoring method) significantly erode confidence in the data record.
Credit Vintages
| Issued | Retired | Available | ||
|---|---|---|---|---|
| 2019 | 7,297 | 7,297 | 0 | |
| 2020 | 16,660 | 12,742 | 3,918 | |
| 2021 | 46,829 | 43,259 | 3,570 | |
| 2022 | 69,547 | 55,588 | 13,959 | |
| 2023 | 66,489 | 61,567 | 4,922 | |
| 2024 | 72,685 | 0 | 72,685 | |
| Total | 279,507 | 180,453 | 99,054 |
Risk Indicators
VVB-confirmed barrier test
reversals not formally confirmed
95 % deduction but contradicted by 0 % in earlier report
Project-specific, measured, reassessed 2023
FPIC, grievance mechanism, benefit sharing documented
CORSIA-eligible; CCP status not stated
⚑ Dispute this rating
Are you the project owner?
Metadata correction (free)
Name, country, marketplace or links incorrect? Let us know.
Does not modify the score.
[email protected] →Pipeline re-run with new documents
Have updated documentation not yet included? You can request a new run of the pipeline with the new inputs.
Submit Documents →Share this rating