Cajambre REDD+ Project
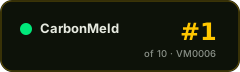
#38of 261 in Soil carbon#23of 124 in Colombia#387of 1339 in Verra (VCS)#1of 10 in VM0006
Audit Analysis
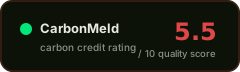
The Cajambre REDD+ project is a well-structured VCS ALM project with VVB-verified additionality, a 14% buffer pool, quantified leakage, and no reported reversal events. However, a major discrepancy between the 2015 validation report's lifetime ex-ante estimate (7.36 million tCO2e) and the 2024 verification report's figure (1.11 million tCO2e) raises significant data-reliability concerns, and the verified ERR for the 2018–2019 monitoring period (531,415 tCO2e) is roughly 7 times the pro-rata expectation derived from the 2024 lifetime estimate, flagging a potential over-crediting risk. Several key parameters (FNRB method, usage monitoring, CORSIA/CCP status) are not stated in the available documents.
Red Flags
- Lifetime ex-ante ERR differs by a factor of ~6.6 between the 2015 validation report (7,358,393 tCO2e) and the 2024 verification report (1,111,200 tCO2e); the basis for this revision is not explained in the extracted record.
- Verified ERR of 531,415 tCO2e for the 2018–2019 monitoring period is approximately 7.2× the pro-rata expectation (74,080 tCO2e) derived from the 2024 lifetime ex-ante estimate, raising over-crediting concerns unless the figure is cumulative across multiple periods.
- Buffer pool percentage is 14% in the 2019 verification report but 10% in the 2014 PDD; the higher (more conservative) 2019 value is privileged, but the discrepancy is unexplained.
- FNRB method and value are not stated in any available document, leaving the forest net regeneration benefit assumption unverifiable.
- A corrective action remains open: verification that final Maximum Mitigation Potential (MMP) calculations are available and legally applicable in the next verification cycle.
Credit Vintages
| Issued | Retired | Available | ||
|---|---|---|---|---|
| 2013 | 13,566 | 13,566 | 0 | |
| 2014 | 128,316 | 72,718 | 55,598 | |
| 2015 | 113,446 | 113,446 | 0 | |
| 2016 | 111,423 | 111,423 | 0 | |
| 2017 | 110,681 | 37,087 | 73,594 | |
| 2018 | 18,000 | 17,500 | 500 | |
| Total | 495,432 | 365,740 | 129,692 |
Risk Indicators
VVB-verified combined test
14% buffer pool, no reversals
Quantified, 25 ha area defined
Project-specific, reassessment date unstated
FPIC, grievance mechanism documented
CORSIA and CCP status not stated
⚑ Dispute this rating
Are you the project owner?
Metadata correction (free)
Name, country, marketplace or links incorrect? Let us know.
Does not modify the score.
[email protected] →Pipeline re-run with new documents
Have updated documentation not yet included? You can request a new run of the pipeline with the new inputs.
Submit Documents →Share this rating