Chyulu Hills REDD+ Project
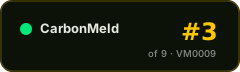
#135of 261 in Soil carbon#90of 157 in Kenya#911of 1339 in Verra (VCS)#3of 9 in VM0009
Audit Analysis
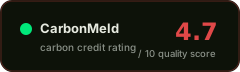
The Chyulu Hills REDD+ project has a verified additionality assessment and a 10% buffer pool with no reported reversals, but is undermined by a project-specific baseline with calculation errors, a 0% leakage deduction for a soil-carbon project, and an extensive list of material findings and corrective actions spanning multiple reporting cycles. The project delivered approximately 86% of its pro-rata ex-ante expectation for the 2017–2020 monitoring period, indicating conservative crediting, yet the depth of documentation deficiencies and unresolved soil-sampling gaps raise meaningful concerns about the robustness of the underlying MRV.
Red Flags
- Baseline emissions calculation used an incorrect equation (F3 instead of F.5) and was missing an exponential function in the denominator; both errors were identified and corrected during verification, indicating the original PDD baseline was unreliable.
- Soil organic carbon was included in the current-period accounting without direct sampling, and proxy area plots were not re-measured due to access constraints; a deviation was approved but the data gap remains.
- Leakage deduction is 0% with only a generic 'quantified' justification, which is weak for a soil-carbon REDD+ project where displacement of soil management practices is plausible.
- An ongoing Mikulolo land-tenure dispute (court case) was identified during verification, and the non-permanence risk score for land tenure was corrected upward to 5, signalling unresolved tenure risk.
- Dozens of material findings and corrective actions span the validation, verification, and monitoring reports, including missing report sections, template version errors, and inaccessible referenced documents.
Credit Vintages
| Issued | Retired | Available | ||
|---|---|---|---|---|
| 2013 | 176,488 | 176,488 | 0 | |
| 2014 | 619,404 | 619,404 | 0 | |
| 2015 | 619,404 | 619,404 | 0 | |
| 2016 | 617,707 | 613,745 | 3,962 | |
| 2017 | 831,453 | 831,453 | 0 | |
| 2018 | 800,866 | 675,470 | 125,396 | |
| 2019 | 770,389 | 702,342 | 68,047 | |
| 2020 | 673,362 | 471,376 | 201,986 | |
| Total | 5,109,073 | 4,709,682 | 399,391 |
Risk Indicators
VVB-confirmed combined test
10% buffer, no reversals, but soil-sampling gaps
0% deduction, generic justification for soil carbon
Project-specific, formula errors found, reassessment date unstated
FPIC, grievance mechanism, and safeguards documented
CORSIA and CCP status not stated
⚑ Dispute this rating
Are you the project owner?
Metadata correction (free)
Name, country, marketplace or links incorrect? Let us know.
Does not modify the score.
[email protected] →Pipeline re-run with new documents
Have updated documentation not yet included? You can request a new run of the pipeline with the new inputs.
Submit Documents →Share this rating