CPA # 1 Improved Cooking Stoves for Nigeria, GS 1162
GS-102 ↗ · current registry ID: GS1162
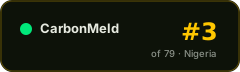
#237of 1329 in Industrial#3of 79 in Nigeria#410of 1801 in Gold Standard (GS)#53of 189 in AMS-II.G
Audit Analysis
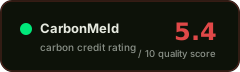
This Gold Standard improved cooking stove project in Nigeria has a VVB-verified combined additionality test and a quantified 5% leakage deduction, but suffers from notable gaps in permanence (no buffer pool, reversal events unaddressed) and a project-specific baseline with no recorded reassessment date. Multiple contradictions across documents—particularly on ERR figures, crediting period, and leakage treatment—reduce confidence in the data record. The verified-to-claimed ratio of roughly 95% for the most recent comparable period is reassuring, but the absence of usage-rate data and CORSIA/CCP status leaves residual over-crediting risk.
Red Flags
- Crediting period differs between the PDD (2011-03-29 to 2021-03-28) and the 2020 verification report (2011-11-10 to 2018-11-09), creating ambiguity about the valid project lifetime and the basis for ex-ante estimates.
- Reversal events are explicitly 'not addressed' and no buffer pool percentage is stated, leaving permanence risk for cooking stoves (discarded, replaced with inefficient units) unquantified.
- ERR figures conflict across documents: the 2020 verification report cites 66,368 tCO₂e while the 2021 monitoring report cites 28,201 tCO₂e for claimed emissions reductions, and the 2013 monitoring report shows only 2,376 tCO₂e verified—making it difficult to confirm a consistent ex-ante baseline.
- Leakage treatment is contradictory: the 2015 verification report records it as 'not addressed' while the 2021 monitoring report records it as 'quantified'; the 5% deduction in the merged record is attributed to the later document but the earlier gap is unexplained.
Credit Vintages
| Issued | Retired | Available | ||
|---|---|---|---|---|
| 2011 | 517 | 0 | 517 | |
| 2012 | 5,024 | 0 | 5,024 | |
| 2013 | 6,956 | 0 | 6,956 | |
| 2014 | 7,769 | 0 | 7,769 | |
| 2015 | 7,356 | 0 | 7,356 | |
| 2016 | 9,207 | 0 | 9,207 | |
| 2017 | 7,470 | 0 | 7,470 | |
| 2018 | 6,487 | 0 | 6,487 | |
| 2019 | 6,839 | 0 | 6,839 | |
| 2020 | 6,185 | 0 | 6,185 | |
| 2021 | 4,795 | 4,795 | 0 | |
| Total | 68,605 | 4,795 | 63,810 |
Risk Indicators
VVB-confirmed combined test
reversals unaddressed
5% quantified deduction
Project-specific; no reassessment date
FPIC, grievance, benefit sharing documented
CORSIA and CCP status not stated
⚑ Dispute this rating
Are you the project owner?
Metadata correction (free)
Name, country, marketplace or links incorrect? Let us know.
Does not modify the score.
[email protected] →Pipeline re-run with new documents
Have updated documentation not yet included? You can request a new run of the pipeline with the new inputs.
Submit Documents →Share this rating