Henrico County Landfill Gas Combustion Project
#87of 189 in Methane#204of 345 in United States#855of 1339 in Verra (VCS)#80of 159 in ACM0001
Audit Analysis
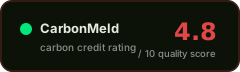
The Henrico County LFG project has a fundamentally sound design—additionality is VVB-confirmed and methane destruction eliminates reversal risk—but is undermined by an extraordinary volume of material findings spanning calibration failures, calculation errors, and data-quality gaps across multiple verification cycles. The project is under-delivering relative to its ex-ante estimate (73.5% of pro-rata expectation), which is conservative, yet the sheer number of unresolved data-quality concerns in the most recent verification report erodes confidence in the verified figure. Documentation is extensive in volume but hampered by low extraction confidence and an unclassified document in the evidence set.
Red Flags
- Over 100 material findings across verification cycles, including repeated calibration failures, incorrect methane density values, outdated emission factors, and raw data not applied in calculations (2024 verification report)
- The 2024 verification report flags that the methane GWP applied was inconsistent with VCS Standard v4.1 requirements and that the eGrid emission factor used was outdated, directly affecting the accuracy of the 36,758 tCO2e verified figure
- min_extraction_confidence is rated 'low', indicating at least one key document was poorly readable, and one evidence document is classified as 'unknown' type
- The Ingenco plant fire of October 2013 (out of commission until December 2013) and multiple gas analyzer failures/replacements indicate significant operational fragility
- Verification period was 4 years instead of the annual frequency specified in the PDD, and NMOC assessment was done every 5 years instead of annually
Credit Vintages
| Issued | Retired | Available | ||
|---|---|---|---|---|
| 2009 | 13,487 | 13,487 | 0 | |
| 2010 | 22,226 | 22,226 | 0 | |
| 2011 | 70,450 | 1,650 | 68,800 | |
| 2012 | 63,567 | 63,567 | 0 | |
| 2013 | 61,779 | 61,779 | 0 | |
| 2014 | 52,062 | 52,062 | 0 | |
| 2015 | 112,710 | 112,710 | 0 | |
| 2016 | 69,427 | 69,427 | 0 | |
| 2017 | 138,990 | 132,963 | 6,027 | |
| 2018 | 71,489 | 71,489 | 0 | |
| 2019 | 56,152 | 19,623 | 36,529 | |
| 2020 | 41,531 | 17,253 | 24,278 | |
| 2021 | 41,343 | 40,160 | 1,183 | |
| 2022 | 36,758 | 0 | 36,758 | |
| Total | 851,971 | 678,396 | 173,575 |
Risk Indicators
VVB-confirmed combined test
Gas destruction – no reversal risk
0% deduction, quantified justification
Project-specific, reassessed 2020
Grievance mechanism present, FPIC not stated
CORSIA and CCP status not stated
⚑ Dispute this rating
Are you the project owner?
Metadata correction (free)
Name, country, marketplace or links incorrect? Let us know.
Does not modify the score.
[email protected] →Pipeline re-run with new documents
Have updated documentation not yet included? You can request a new run of the pipeline with the new inputs.
Submit Documents →Share this rating