Improved Cookstoves for Social Impact in Ugandan Communities
GS-793 ↗ · current registry ID: GS447
#637of 1329 in Industrial#75of 163 in Uganda#966of 1801 in Gold Standard (GS)
Audit Analysis
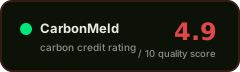
This Gold Standard cookstove project in Uganda has a fundamentally sound design with VVB-verified additionality and no reversal events, but is severely undermined by an extraordinary volume of material findings (over 60) and corrective actions (over 40) that point to persistent data-quality and reporting weaknesses. The project-specific baseline, absence of a stated buffer pool, a 13% gap between assumed and verified usage rates, and unresolved contradictions in ERR figures and leakage treatment collectively limit confidence in the integrity and safety of the claimed credits.
Red Flags
- Over 60 material findings and 40+ corrective actions reported in the 2025 verification report, indicating systemic data-quality and reporting deficiencies
- Usage rate assumed at 0.90 but verified at only 0.7793, a 13% gap that inflates ex-ante claims relative to observed performance
- Contradiction in total ERR claimed: 994,730 tCO2e in the verification report versus 769,152 tCO2e in the monitoring report for the same period
- Leakage justification shifted from 'deemed negligible' (Jan 2025) to 'quantified' (Dec 2025) within the same verification cycle, with a 0% deduction in both cases
Credit Vintages
| Issued | Retired | Available | ||
|---|---|---|---|---|
| 2007 | 14,976 | 14,976 | 0 | |
| 2008 | 42,161 | 42,147 | 14 | |
| 2009 | 109,310 | 109,134 | 176 | |
| 2010 | 169,084 | 169,084 | 0 | |
| 2011 | 220,542 | 220,542 | 0 | |
| 2012 | 335,612 | 335,612 | 0 | |
| 2013 | 482,134 | 482,134 | 0 | |
| 2014 | 713,792 | 712,692 | 1,100 | |
| 2015 | 711,962 | 711,962 | 0 | |
| 2016 | 613,532 | 613,532 | 0 | |
| 2017 | 787,747 | 787,689 | 58 | |
| 2018 | 764,535 | 762,212 | 2,323 | |
| 2019 | 759,570 | 757,548 | 2,022 | |
| 2020 | 703,298 | 693,078 | 10,220 | |
| 2021 | 1,078,354 | 1,002,596 | 75,758 | |
| 2022 | 1,131,153 | 1,026,058 | 105,095 | |
| 2023 | 1,053,423 | 179,577 | 873,846 | |
| 2024 | 1,083,453 | 72,189 | 1,011,264 | |
| 2025 | 629,560 | 0 | 629,560 | |
| Total | 11,404,198 | 8,692,762 | 2,711,436 |
Risk Indicators
VVB-confirmed combined test
no reversals
0% deduction; justification inconsistent
Project-specific; reassessed 2024
Grievance & benefit-sharing present; FPIC not stated
CORSIA & CCP status not stated
⚑ Dispute this rating
Are you the project owner?
Metadata correction (free)
Name, country, marketplace or links incorrect? Let us know.
Does not modify the score.
[email protected] →Pipeline re-run with new documents
Have updated documentation not yet included? You can request a new run of the pipeline with the new inputs.
Submit Documents →Share this rating