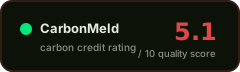
Kikonda Forest Reserve
GS-1798 ↗ · current registry ID: GS2990
#52of 163 in Uganda#726of 1801 in Gold Standard (GS)
Audit Analysis
The Kikonda Forest Reserve reforestation project has a long operational history (since 2002) and a VVB-verified investment additionality test, supported by a 20% buffer pool. However, the 2024 verification report lists over twenty material findings—including survival rates below the assumed 90%, data inconsistencies, ongoing cattle encroachment, and unresolved community conflicts—along with reversal events that were not addressed, which significantly erode confidence in the integrity and permanence of the claimed reductions.
Red Flags
- Survival percentage in sampled areas was below the 90% used in carbon calculations, requiring a downward revision to 80% (2024 verification report).
- Reversal events are listed as 'not addressed' in the extracted record, leaving permanence risk unquantified for this A/R project.
- Ongoing cattle encroachment, conflicts between Forest Guards and cattle keepers, and unimplemented mitigation measures (water dams, kraal, fencing) represent a persistent threat to planted trees.
- FPIC status is contradictory: the 2013 verification report confirms FPIC was conducted, while the 2022 PDD states it was not, creating uncertainty about free, prior, and informed consent.
- Leakage is described as 'quantified' in the justification, yet no actual deduction percentage is stated in any available document.
Credit Vintages
| Issued | Retired | Available | ||
|---|---|---|---|---|
| 2008 | 3,946 | 3,946 | 0 | |
| 2009 | 3,681 | 3,681 | 0 | |
| 2010 | 2,664 | 2,664 | 0 | |
| 2011 | 19,433 | 16,628 | 2,805 | |
| 2012 | 72,008 | 71,926 | 82 | |
| 2013 | 40,963 | 40,963 | 0 | |
| 2014 | 69,048 | 67,048 | 2,000 | |
| 2015 | 133,628 | 132,719 | 909 | |
| 2016 | 135,062 | 114,572 | 20,490 | |
| 2017 | 137,455 | 20,456 | 116,999 | |
| 2018 | 165,090 | 0 | 165,090 | |
| 2019 | 219,215 | 0 | 219,215 | |
| 2020 | 196,565 | 0 | 196,565 | |
| 2021 | 149,828 | 0 | 149,828 | |
| 2022 | 5,534 | 0 | 5,534 | |
| Total | 1,354,120 | 474,603 | 879,517 |
Risk Indicators
VVB-confirmed investment test
mixed evidence / unresolved risk
Quantified justification but no stated percentage
Project-specific baseline, reassessed 2017
Grievance mechanism present; FPIC status contradictory
CORSIA and CCP status not stated
⚑ Dispute this rating
Are you the project owner?
Metadata correction (free)
Name, country, marketplace or links incorrect? Let us know.
Does not modify the score.
[email protected] →Pipeline re-run with new documents
Have updated documentation not yet included? You can request a new run of the pipeline with the new inputs.
Submit Documents →Share this rating