Methane Capture and Destruction at Simplot's Moses Lake Wastewater Treatment Facility
#105of 110 in Water#331of 389 in United States#1260of 1339 in Verra (VCS)#7of 7 in ACM0014
Audit Analysis
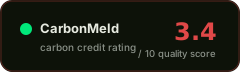
This VCS methane destruction project at Simplot's Moses Lake facility has a confirmed investment-test additionality and no reversal events, but is severely undermined by over 50 material findings spanning calculation errors, flow-meter underreporting of approximately 19%, a flare uninspected since 2018, and permit violations at the facility. The sheer volume of corrective actions and the inconsistency of key parameters (leakage deduction, grid emission factor, baseline characterization) across documents indicate systemic MRV quality problems that cast serious doubt on the reliability of the 31,783 tCO₂e verified for 2023.
Red Flags
- Flow meters (boiler and flare) found underreporting by 18.69% and 19.85% during calibration, directly affecting project-emission and energy-recovery calculations
- Flare not inspected since 1 August 2018; deviation required justification and evidence of daily inspection efficacy
- Over 50 material findings and 50+ corrective actions across multiple reporting periods, including incorrect QCH4 formula, inconsistent methane density values, and transcription errors between daily logs and MMS data
- Permit ST0005202 issued to Simplot's Moses Lake facility has reporting and monitoring violations over the past five years (flagged in CAR 1 of the PDD review)
- ERRs for 2023 (31,783 tCO₂e) exceed ex-ante estimates despite reduced wastewater and energy inputs, a discrepancy the VVB required the project to justify
Credit Vintages
| Issued | Retired | Available | ||
|---|---|---|---|---|
| 2007 | 2,083 | 0 | 2,083 | |
| 2008 | 11,010 | 11,010 | 0 | |
| 2009 | 21,124 | 21,124 | 0 | |
| 2010 | 37,935 | 37,935 | 0 | |
| 2011 | 20,112 | 20,112 | 0 | |
| 2012 | 46,347 | 46,347 | 0 | |
| 2013 | 19,692 | 19,692 | 0 | |
| 2014 | 24,805 | 24,805 | 0 | |
| 2015 | 26,833 | 26,833 | 0 | |
| 2016 | 27,563 | 27,563 | 0 | |
| 2017 | 33,699 | 33,699 | 0 | |
| 2018 | 31,501 | 26,464 | 5,037 | |
| 2019 | 28,924 | 28,924 | 0 | |
| 2020 | 25,103 | 25,103 | 0 | |
| 2021 | 31,007 | 31,007 | 0 | |
| 2022 | 34,158 | 34,158 | 0 | |
| 2023 | 31,783 | 31,783 | 0 | |
| Total | 453,679 | 446,559 | 7,120 |
Risk Indicators
VVB-confirmed investment test
Destruction project, no reversals
0% deduction, inconsistent justification
Project-specific, measured, no reassessment date
FPIC and grievance mechanism documented
CORSIA excluded, CCP status not stated
⚑ Dispute this rating
Are you the project owner?
Metadata correction (free)
Name, country, marketplace or links incorrect? Let us know.
Does not modify the score.
[email protected] →Pipeline re-run with new documents
Have updated documentation not yet included? You can request a new run of the pipeline with the new inputs.
Submit Documents →Share this rating