Natural High Forest Rehabilitation Project on degraded land of Kibale National Park
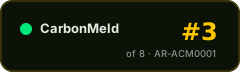
#107of 261 in Soil carbon#76of 163 in Uganda#805of 1339 in Verra (VCS)#3of 8 in AR-ACM0001
Audit Analysis
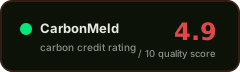
A long-running (60-year) forest rehabilitation project in Kibale National Park with VVB-confirmed additionality, a 15% buffer pool, and no reported reversals, but burdened by an extensive list of material findings including a methodology deviation in biomass conversion factors, a significant planting-area shortfall (4,025 ha vs. 6,000 ha planned), a mid-project proponent change, and documentation that was formally deemed incomplete and non-conforming. The project over-delivered relative to its pro-rata ex-ante expectation (≈175 %), which is reassuring, yet the project-specific baseline, unquantified 0 % leakage deduction, and low extraction confidence across 49 source documents limit confidence in the underlying data.
Red Flags
- Planting area shortfall: actual planted area of 4,025 ha is 33 % below the 6,000 ha planned in the PDD, raising over-crediting risk if the ex-ante estimate was not proportionally revised
- Methodology deviation: incorrect fresh-to-dry-weight conversion factors (branch factors used instead of stem biomass factors) led to underestimation of carbon stock in earlier periods; correction applied but historical credits may be affected
- Project proponent changed from Face the Future to GreenChoice during the monitoring period, with additionality implications not fully clarified
- Leakage deduction of 0 % justified only as 'deemed negligible' without a quantified assessment, which is thin for a 6,000-ha forest project in a high-biodiversity national park
- Documentation formally deemed incomplete and of insufficient quality; joint CCB-VCS verification template used instead of separate VCS templates; two Forward Action Requests remain open
Credit Vintages
| Issued | Retired | Available | ||
|---|---|---|---|---|
| 2009 | 372,381 | 372,296 | 85 | |
| 2011 | 173,015 | 173,015 | 0 | |
| 2014 | 229,902 | 229,817 | 85 | |
| 2017 | 199,544 | 197,281 | 2,263 | |
| 2020 | 29,113 | 19,249 | 9,864 | |
| 2021 | 34,935 | 34,921 | 14 | |
| 2022 | 34,935 | 22,097 | 12,838 | |
| 2023 | 5,822 | 5,822 | 0 | |
| Total | 1,079,647 | 1,054,498 | 25,149 |
Risk Indicators
VVB-confirmed combined test
15 % buffer, no reversals
0 % deduction, qualitative justification only
Project-specific, reassessment date not stated
FPIC, grievance mechanism, benefit sharing documented
CORSIA and CCP status not stated
⚑ Dispute this rating
Are you the project owner?
Metadata correction (free)
Name, country, marketplace or links incorrect? Let us know.
Does not modify the score.
[email protected] →Pipeline re-run with new documents
Have updated documentation not yet included? You can request a new run of the pipeline with the new inputs.
Submit Documents →Share this rating