Reduction of deforestation and degradation in Tambopata National Reserve and Bahuaja-Sonene National Park within the area of Madre de Dios region –Peru
#111of 261 in Soil carbon#10of 24 in Peru#813of 1339 in Verra (VCS)#10of 27 in VM0007
Audit Analysis
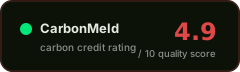
This VCS REDD+ project in Peru's Tambopata and Bahuaja-Sonene reserves has VVB-confirmed additionality and a 13% buffer pool, but is burdened by an extraordinary volume of material findings (41 non-conformities, 27 information requests, dozens of corrective actions) across multiple verification cycles. The 0% leakage deduction in a project with over 2,100 ha of deforestation in the leakage belt, combined with numerous methodology deviations and data inconsistencies, raises meaningful concerns about the robustness of the credit claims. All identified issues were reportedly closed, and the project delivered roughly 88% of its pro-rata expectation for the 2021–2023 monitoring period, but the sheer density of quality gaps warrants caution.
Red Flags
- 0% leakage deduction in the 2022 verification report despite 2,167.70 ha of deforestation recorded in the leakage belt; the VVB itself flagged insufficient justification for the zero value
- 41 Non-Conformity Reports, 27 New Information Requests, and 1 Observation raised in a single verification cycle, plus dozens of additional CARs and NCs across earlier cycles — an unusually high volume of quality issues
- Reversal events marked as 'reported' in the 2022 verification report (vs. 'none reported' in 2021), with risk factors for ongoing enforcement and project longevity flagged
- Multiple methodology deviations accepted, including use of park ranger reports instead of participatory rural appraisal for degradation monitoring, and satellite-imagery validation instead of field verification due to security risks
- Leakage justification shifted from 'deemed negligible' (2019) to 'quantified' (2022) while the deduction remained at 0%, creating ambiguity about the actual basis for the zero value
Credit Vintages
| Issued | Retired | Available | ||
|---|---|---|---|---|
| 2010 | 72,240 | 54,558 | 17,682 | |
| 2011 | 597,059 | 567,554 | 29,505 | |
| 2013 | 412,672 | 411,900 | 772 | |
| 2014 | 45,467 | 44,135 | 1,332 | |
| 2015 | 621,242 | 620,611 | 631 | |
| 2016 | 426,823 | 426,823 | 0 | |
| 2017 | 264,004 | 255,892 | 8,112 | |
| 2018 | 617,226 | 613,069 | 4,157 | |
| 2019 | 751,775 | 707,028 | 44,747 | |
| 2020 | 692,648 | 550,530 | 142,118 | |
| Total | 4,501,156 | 4,252,100 | 249,056 |
Risk Indicators
VVB-confirmed combined test
Buffer pool present; risk factors flagged in 2022
0% deduction; VVB flagged insufficient justification
Project-specific; reassessed 2020 (within interval)
FPIC, grievance mechanism, safeguards documented
CORSIA and CCP status not stated
⚑ Dispute this rating
Are you the project owner?
Metadata correction (free)
Name, country, marketplace or links incorrect? Let us know.
Does not modify the score.
[email protected] →Pipeline re-run with new documents
Have updated documentation not yet included? You can request a new run of the pipeline with the new inputs.
Submit Documents →Share this rating