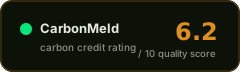
Sanibey Dam And Hydroelectric Power Plant
Score Breakdown
Integrity
verified Additionality is confirmed by the VVB using an investment test (validation report).
missing Baseline/crediting inputs show inconsistencies across documents (ERR totals, grid emission factor, and crediting period), increasing over-crediting risk.
Transparency
verified Monitoring period is clearly stated (2020-12-02 to 2023-11-30) and the same ERR figure is shown as claimed and verified in the extracted record (monitoring/validation materials).
missing Conflicting figures across report versions reduce traceability and confidence in what was ultimately monitored/verified.
Claim Safety
verified Uses an established grid-connected renewable methodology (ACM0002 v21.0) with a stated baseline reassessment year (2022).
missing CORSIA and CCP status are not stated in the extracted record, and contradictions in ERR and grid EF elevate greenwashing/over-crediting risk.
Documentation
verified A relatively complete document set is referenced (PDD, monitoring report, validation report, issuance) with high extraction confidence and 17 documents used.
missing Numerous corrective action requests (CAR-1 to CAR-13) indicate documentation/MRV issues that required remediation.
Detailed Analysis
Integrity
The validation documentation confirms additionality via an investment test and indicates it was confirmed by the VVB (validation report). However, the baseline is project-specific and key baseline drivers vary across validation versions, including the grid emission factor (0.4616 vs 0.5429) and the total verified/claimed ERs (889,111 vs 1,460,318 tCO2e), which undermines confidence in baseline validity and credit quantification. Leakage is applied as a 0% deduction, but the monitoring report does not address leakage while the later validation report only deems it negligible, leaving a weak evidentiary basis for zero leakage.
Transparency
The monitoring period is clearly defined as 2020-12-02 to 2023-11-30 (monitoring report dated 2024-07-24), and the extracted record shows the same ER number as claimed and verified for the period (889,111 tCO2e). Transparency is reduced by conflicting values across report versions for ER totals, grid emission factor, and even the stated crediting period, making it harder for third parties to reconcile what was ultimately validated/verified. The VVB is identified as RINA, which supports audit traceability, but the volume of CARs suggests MRV clarifications were needed.
Claim Safety
Over-crediting risk is elevated because two validation report versions present materially different ER totals (889,111 vs 1,460,318 tCO2e) and different grid emission factors (0.4616 vs 0.5429), both of which directly affect credited reductions. Leakage is treated as 0% with inconsistent supporting narrative between monitoring and validation, which weakens defensibility of claims. CORSIA eligibility and CCP status are not stated in the extracted record, so buyers cannot easily assess alignment with higher-integrity claim frameworks from the available extracted information.
Documentation
The extracted record indicates a broad evidence base (PDD, monitoring report, validation report, issuance) and a relatively high document count (17), with high extraction confidence. Documentation quality is nonetheless mixed because the monitoring/verification cycle generated many corrective action requests (CAR-1 through CAR-13), implying gaps or issues that required correction. Contradictions between older and newer monitoring reports on safeguards-related disclosures (FPIC, grievance mechanism, benefit sharing) also point to inconsistent documentation over time.
Overall
I privilege the more recent documents where conflicts exist: the 2024 monitoring report for the monitoring period and crediting period statement, and the 2024-09-09 validation report for the grid emission factor and the 889,111 tCO2e ER figure, because they are later versions and more likely to reflect final agreed parameters. However, the existence of multiple conflicting versions (including a 2022 validation report showing 1,460,318 tCO2e and a higher grid EF) is itself a material reliability concern and drives scores down across integrity, transparency, and claim safety. Leakage and safeguards narratives are also inconsistent across time (2012 vs 2024 monitoring), further increasing reputational and over-crediting risk.
Audit Analysis
The project has VVB-confirmed additionality and recent monitoring/validation documentation, but several internal inconsistencies across documents raise reliability concerns. Leakage treatment is weakly supported (0% deduction with inconsistent justification), and key parameters (grid emission factor, crediting period, and ERR totals) vary between versions of reports, increasing over-crediting risk.
Project Description
The Sanibey Dam & HEPP project is a hydroelectric power plant located in Turkey's Eastern Mediterranean Region. The project reduces greenhouse gas emissions by avoiding electricity generation from fossil fuel sources, resulting in an estimated annual reduction of 524,729 tonnes of CO2e. The project has been generating electricity since December 2010 and the first crediting period will end on December 1st, 2020.
Red Flags
- Large discrepancy in reported verified/claimed emission reductions between validation reports (889,111 vs 1,460,318 tCO2e).
- Grid emission factor differs materially between validation reports (0.4616 vs 0.5429), affecting baseline emissions and credit volume.
- Leakage is taken as 0% but is either not addressed (monitoring report 2024) or only asserted as negligible (validation report 2024).
- Safeguards/FPIC/grievance/benefit-sharing are reported as present in 2024 monitoring but absent in 2012 monitoring, suggesting inconsistent social documentation.
Credit Vintages
| Issued | Retired | Available | ||
|---|---|---|---|---|
| 2010 | 936,348 | 837,920 | 98,428 | |
| 2012 | 230,753 | 230,753 | 0 | |
| 2013 | 383,952 | 383,952 | 0 | |
| 2014 | 269,115 | 150,191 | 118,924 | |
| 2015 | 572,720 | 0 | 572,720 | |
| 2016 | 353,741 | 0 | 353,741 | |
| 2017 | 380,281 | 0 | 380,281 | |
| 2018 | 439,976 | 0 | 439,976 | |
| 2019 | 609,312 | 0 | 609,312 | |
| 2020 | 518,653 | 0 | 518,653 | |
| 2021 | 271,702 | 100,000 | 171,702 | |
| 2022 | 346,536 | 0 | 346,536 | |
| 2023 | 254,735 | 0 | 254,735 | |
| Total | 5,567,824 | 1,702,816 | 3,865,008 |
Cosa migliorerebbe questo punteggio
- Publish a clear change log or consolidated final parameter table reconciling ER totals, grid emission factor, and crediting period across all report versions, with explicit justification for any revisions.
- Provide a documented leakage assessment consistent across validation and monitoring (even if negligible) and disclose safeguards evidence (FPIC records, grievance process details, benefit-sharing arrangements) in a consistent, auditable format.
Questi suggerimenti indicano quali prove pubbliche aggiuntive potrebbero migliorare il livello di confidenza di questa valutazione. Non garantiscono un punteggio futuro più alto.
Risk Indicators
VVB-confirmed investment test
Avoidance project; no reversals reported
0% leakage with weak/inconsistent justification
Project-specific baseline; key parameters inconsistent
Safeguards reported but inconsistent over time
CORSIA/CCP status not stated
Where to buy
Marketplaces
+ Know where to buy this?
Listing multiple projects? Send us a CSV at [email protected].
⚑ Dispute this rating
Sei il proprietario di questo progetto?
Correzione metadati (gratuita)
Nome, paese, marketplace o link errati? Segnalacelo.
Non modifica lo score.
[email protected] →Rivalutazione con nuovi documenti
Hai documentazione aggiornata non ancora inclusa? Puoi richiedere un nuovo run della pipeline con i nuovi input.
Invia Documenti →