Wind Power Project At Anthiyur, Tamil Nadu
#720of 1935 in Renewable energy#352of 975 in India#432of 1339 in Verra (VCS)#247of 806 in AMS-I.D
Audit Analysis
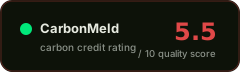
A registered VCS wind power project in Tamil Nadu with a sound jurisdictional baseline and VVB-confirmed additionality, but plagued by extensive documentation deficiencies, repeated meter calibration delays, a proponent name inconsistency, and a VVB rotation non-conformity that collectively undermine confidence in the MRV chain. The project delivered 105% of its pro-rata ex-ante expectation for the 2023 monitoring period, indicating no over-crediting, yet the volume of corrective actions and material findings across multiple verification cycles signals persistent operational and reporting weaknesses.
Red Flags
- VVB rotation requirements under VCS Standard Section 4.1.20(2) were not met, and the VVB was required to open an internal non-conformity for the contract review process.
- Project proponent name is inconsistent between the Project Design Document (Nuziveedu Seeds Limited) and the Monitoring Report (Windage Power Company), raising questions about entity continuity and accountability.
- The validation report dated 29 August 2018 exceeded the two-year renewal eligibility deadline mandated by the VCS Standard, and Verra had to issue an extension.
- Repeated meter calibration delays across multiple monitoring periods (e.g., May–August 2018 for all 9 WTGs), requiring application of a 0.2% error factor, indicate systemic MRV maintenance gaps.
- In one earlier monitoring period, actual emission reductions were 48.87% lower than the registered PD estimate (10,485 vs 20,505 tCO2e) due to low plant load factor and shutdowns, suggesting the ex-ante estimate was optimistic.
Credit Vintages
| Issued | Retired | Available | ||
|---|---|---|---|---|
| 2006 | 34,566 | 34,566 | 0 | |
| 2007 | 35,501 | 35,501 | 0 | |
| 2008 | 34,321 | 34,321 | 0 | |
| 2009 | 39,244 | 39,244 | 0 | |
| 2010 | 34,653 | 34,653 | 0 | |
| 2011 | 31,994 | 31,994 | 0 | |
| 2012 | 38,597 | 38,597 | 0 | |
| 2013 | 29,757 | 29,757 | 0 | |
| 2014 | 23,149 | 23,149 | 0 | |
| 2015 | 15,286 | 15,286 | 0 | |
| 2016 | 30,435 | 30,435 | 0 | |
| 2017 | 35,766 | 35,766 | 0 | |
| 2018 | 31,093 | 31,060 | 33 | |
| 2019 | 30,448 | 30,448 | 0 | |
| 2020 | 29,742 | 29,079 | 663 | |
| 2021 | 29,691 | 4,558 | 25,133 | |
| 2022 | 3,280 | 1,315 | 1,965 | |
| Total | 507,523 | 479,729 | 27,794 |
Risk Indicators
VVB-confirmed investment test
Avoidance project, no reversal events
0% deduction, justified for grid-fed wind
Jurisdictional grid EF, 2023 value
FPIC and grievance present but documentation gaps
CORSIA and CCP status not stated
Where to buy
Marketplaces
+ Know where to buy this?
Listing multiple projects? Send us a CSV at [email protected].
⚑ Dispute this rating
Are you the project owner?
Metadata correction (free)
Name, country, marketplace or links incorrect? Let us know.
Does not modify the score.
[email protected] →Pipeline re-run with new documents
Have updated documentation not yet included? You can request a new run of the pipeline with the new inputs.
Submit Documents →Share this rating