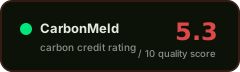
Albany Water Board - Improved Forest Management Project
#32of 99 in REDD+#137of 345 in United States#57of 147 in American Carbon Registry (ACR)
Audit Analysis
The Albany Water Board forest management project has a verified additionality test, a conservative 40% leakage deduction, and a 14% buffer pool, but is undermined by an extensive and recurring pattern of non-conformities across multiple verification cycles—including calculation errors in core GHG quantification, missing evidence for the financial barrier test, and contradictions in ERR figures and buffer pool percentages between documents. The project is delivering below its ex-ante expectation (72% of pro-rata), which is conservative, but the systemic MRV quality issues raise material concerns about the reliability of the underlying data.
Red Flags
- Extensive and recurring non-conformities across at least four verification cycles (2020–2025), including errors in uncertainty calculations, baseline quantification, and GHG removal values, indicating systemic MRV weaknesses
- Contradiction in buffer pool percentage: the 2023 verification report states 14% while the 2025 monitoring report states 18%, creating uncertainty about the correct reversal-risk allocation
- Contradiction in total ERR: the 2023 verification report records 33,736 tCO2e while the 2025 validation report records 26,305 tCO2e, a 22% discrepancy that was not clearly reconciled in the extracted record
- Missing quantitative evidence (NPV/IRR) for the financial barrier test and missing verifiable evidence for low fire-risk and disease/pest risk ratings, as flagged in the verification reports
- Recurring errors in referencing the correct ACR Standard version (v2.1, v5.0, v7.0) across multiple monitoring reports, suggesting inadequate document control
Credit Vintages
| Issued | Retired | Available | ||
|---|---|---|---|---|
| 2017 | 33,831 | 33,831 | 0 | |
| 2018 | 13,364 | 13,364 | 0 | |
| 2019 | 29,853 | 29,800 | 53 | |
| 2020 | 39,228 | 39,228 | 0 | |
| 2021 | 39,309 | 20,685 | 18,624 | |
| 2022 | 37,057 | 14,857 | 22,200 | |
| 2023 | 23,152 | 3,940 | 19,212 | |
| Total | 215,794 | 155,705 | 60,089 |
Risk Indicators
Combined test, VVB-verified
Buffer pool present; earlier reversal event noted
40% quantified deduction
Project-specific, no reassessment date
Mentioned; FPIC and grievance not stated
CORSIA and CCP status not stated
⚑ Dispute this rating
Are you the project owner?
Metadata correction (free)
Name, country, marketplace or links incorrect? Let us know.
Does not modify the score.
[email protected] →Pipeline re-run with new documents
Have updated documentation not yet included? You can request a new run of the pipeline with the new inputs.
Submit Documents →Share this rating