GS1247 VPA 14 Improved Kitchen Regimes NTARAMA (Bugesera), Rwanda
GS-590 ↗ · current registry ID: GS3447
#960of 1329 in Industrial#85of 139 in Rwanda#1386of 1801 in Gold Standard (GS)
Audit Analysis
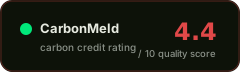
This Gold Standard cookstove project in Rwanda has a confirmed additionality assessment and a recently reassessed baseline, but suffers from a severe gap between the PDD's assumed usage rate (90%) and the verified rate (23.3%), indicating the project delivers far fewer household-level benefits than originally designed. The absence of a buffer pool, a 0% leakage deduction justified only as 'deemed negligible' (contradicted by the PDD's 5% figure), and numerous open corrective actions and forward action requests further weaken the project's robustness. While the verified ERR of 14,711 tCO₂e matches the claimed figure, the underlying performance shortfall and documentation inconsistencies raise meaningful concerns about long-term delivery and data reliability.
Red Flags
- Verified usage rate of 23.3% is less than one-third of the PDD's assumed 90%, indicating the project delivers far fewer household-level benefits than designed; the earlier monitoring report also flagged a drop from 28.3% to 23.3% between periods
- Leakage deduction is 0% with a 'deemed negligible' justification in the verification report, yet the PDD (dated 2025) references a 5% deduction — an unexplained contradiction that undermines the leakage treatment
- Thirteen contradictions across documents (ERR figures, fNRB values, usage rates, crediting period dates, leakage treatment, additionality test type) signal significant data-reliability and version-control problems
- Multiple Forward Action Requests (FAR 01–05) remain open, including VPA-level SDG indicator evaluation and fNRB reporting, indicating incomplete compliance with Gold Standard requirements
Credit Vintages
| Issued | Retired | Available | ||
|---|---|---|---|---|
| 2014 | 1,598 | 1,598 | 0 | |
| 2015 | 9,837 | 9,837 | 0 | |
| 2016 | 10,000 | 10,000 | 0 | |
| 2017 | 9,885 | 6,284 | 3,601 | |
| 2018 | 8,918 | 8,740 | 178 | |
| 2019 | 6,206 | 6,090 | 116 | |
| 2020 | 2,272 | 2,268 | 4 | |
| 2021 | 1,022 | 1,022 | 0 | |
| Total | 49,738 | 45,839 | 3,899 |
Risk Indicators
VVB-confirmed combined test
usage declining
0% deduction; PDD suggests 5%
Project-specific; reassessed 2024
FPIC, grievance mechanism, safeguards documented
CORSIA and CCP status not stated
⚑ Dispute this rating
Are you the project owner?
Metadata correction (free)
Name, country, marketplace or links incorrect? Let us know.
Does not modify the score.
[email protected] →Pipeline re-run with new documents
Have updated documentation not yet included? You can request a new run of the pipeline with the new inputs.
Submit Documents →Share this rating