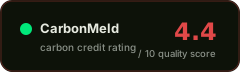
Shimba Hills Improved Cook Stoves
GS-1209 ↗ · current registry ID: GS824
#991of 1329 in Industrial#125of 157 in Kenya#1420of 1801 in Gold Standard (GS)
Audit Analysis
The Shimba Hills Improved Cook Stoves project (Gold Standard, Kenya) has a structurally sound design with an investment additionality test, safeguards, and a named VVB, but is undermined by severe contradictions in emission-reduction figures across documents (a 9× discrepancy in the ex-ante lifetime estimate), a project-specific baseline with no recorded reassessment, no stated buffer pool, and a long history of material findings and corrective actions spanning multiple verification cycles. The project delivered roughly 61% of the pro-rata expectation for the elapsed monitoring period (using the PDD ex-ante figure), which is conservative, but the data-reliability issues cast doubt on the precision of all reported figures.
Red Flags
- Ex-ante lifetime ERR differs by a factor of ~9 between the PDD (680,437 tCO₂e) and the monitoring report (73,562 tCO₂e), both dated November 2017 — a fundamental data-reliability issue
- Verified ERR differs between the 2017 verification report (39,496) and the 2018 issuance record (69,238), a 76% gap that is not explained in the extracted record
- fNRB value rose from 0.73 (2017 VR) to 0.92 (2018 VR) and the method shifted from local field measurement to national default, increasing claimed reductions without a clear documented justification
- No buffer pool percentage, no permanence claim duration, and no baseline reassessment date are stated in any available document
- Repeated material findings across at least four verification cycles (2014, 2017, 2018) indicate persistent documentation and calculation-quality problems, including stove-ID mismatches, missing calibration records, and ER spreadsheet errors
Credit Vintages
| Issued | Retired | Available | ||
|---|---|---|---|---|
| 2010 | 4,308 | 3,688 | 620 | |
| 2011 | 33,418 | 28,917 | 4,501 | |
| 2012 | 47,700 | 47,196 | 504 | |
| 2013 | 26,688 | 20,917 | 5,771 | |
| 2014 | 25,283 | 22,678 | 2,605 | |
| 2015 | 21,437 | 21,009 | 428 | |
| 2016 | 50,040 | 50,034 | 6 | |
| 2017 | 24,542 | 24,542 | 0 | |
| Total | 233,416 | 218,981 | 14,435 |
Risk Indicators
Investment test in PDD; VVB confirmation not explicitly stated
no reversal events found
0% deduction, 'deemed negligible'; minor contradiction with 2014 VR
Project-specific baseline; no reassessment date found in records
Grievance mechanism and benefit-sharing present; FPIC not stated
CCP and CORSIA status not stated in available documents
⚑ Dispute this rating
Are you the project owner?
Metadata correction (free)
Name, country, marketplace or links incorrect? Let us know.
Does not modify the score.
[email protected] →Pipeline re-run with new documents
Have updated documentation not yet included? You can request a new run of the pipeline with the new inputs.
Submit Documents →Share this rating