The Kasigau Corridor REDD Project – Phase I Rukinga Sanctuary
#190of 261 in Soil carbon#139of 157 in Kenya#1148of 1339 in Verra (VCS)#6of 9 in VM0009
Audit Analysis
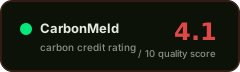
The Kasigau Corridor REDD+ Phase I project has a verified combined additionality test, a 13% buffer pool, and no reported reversals, but is undermined by a 0% leakage deduction in a forest-conservation context, a project-specific baseline, an extremely low pro-rata delivery ratio (~11%), and a long history of material findings including serious community grievances (sexual offenses, intimidation) and a PIR that failed to report a ranger fatality. The low extraction confidence and numerous ERR-figure contradictions further erode confidence in the data.
Red Flags
- Verified ERR of 225,194 tCO2e represents only ~11% of the pro-rata lifetime expectation (3,500,000 × 17/30 ≈ 1,983,333) for the 2005–2021 monitoring span, indicating severe under-delivery against the ex-ante estimate.
- Leakage deduction dropped from 13.58% (2013 verification) to 0% (2023 verification) in a REDD+ project where displacement of deforestation pressure is a well-known risk; the justification shifted from 'deemed negligible' to 'quantified' yet the deduction is still zero.
- The PIR failed to report the death of a wildlife ranger, incorrectly stating no fatalities in the past 10 years; sexual offenses, intimidation, and unfair employment practices were also documented in community grievances.
- The ex-ante lifetime ERR estimate was revised downward from 7,630,494 tCO2e (2016 monitoring report) to 3,500,000 tCO2e (2021 verification report), a 54% reduction, without clear justification in the extracted record.
- 35 VCS findings, 7 non-conformances, 5 clarification requests, and multiple forward action requests were identified in a single verification cycle, indicating systemic MRV and reporting weaknesses.
Credit Vintages
| Issued | Retired | Available | ||
|---|---|---|---|---|
| 2012 | 201,148 | 201,148 | 0 | |
| 2013 | 207,446 | 207,446 | 0 | |
| 2014 | 218,260 | 218,260 | 0 | |
| 2015 | 290,972 | 290,972 | 0 | |
| 2016 | 375,656 | 289,291 | 86,365 | |
| 2017 | 191,264 | 42,019 | 149,245 | |
| 2018 | 207,335 | 207,335 | 0 | |
| 2019 | 220,877 | 219,837 | 1,040 | |
| 2020 | 278,584 | 249,818 | 28,766 | |
| 2021 | 235,288 | 225,540 | 9,748 | |
| 2022 | 195,918 | 0 | 195,918 | |
| Total | 2,622,748 | 2,151,666 | 471,082 |
Risk Indicators
VVB-confirmed combined test
13% buffer, no reversals, but extensive non-permanence findings
0% deduction in REDD+ context; was 13.58% in 2013
Project-specific; reassessed 2023; VVB flagged 10-yr requirement
FPIC and grievance mechanism present; serious community grievances documented
CORSIA and CCP status not stated in available documents
⚑ Dispute this rating
Are you the project owner?
Metadata correction (free)
Name, country, marketplace or links incorrect? Let us know.
Does not modify the score.
[email protected] →Pipeline re-run with new documents
Have updated documentation not yet included? You can request a new run of the pipeline with the new inputs.
Submit Documents →Share this rating