TIST Program in Uganda, VCS-CCB 011
#154of 261 in Soil carbon#115of 163 in Uganda#1017of 1339 in Verra (VCS)#61of 97 in AR-ACM0003
Audit Analysis
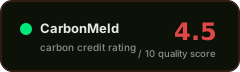
The TIST cookstove project in Uganda has a VVB-confirmed additionality assessment and a 10% buffer pool with no reported reversals, but is undermined by a critical discrepancy in lifetime ex-ante ERR figures (676,317 vs 5,139,342 tCO₂e) between two verification reports issued four days apart, a Forward Action Request on double counting across TIST projects, and over 15 material findings requiring corrective action. The 0% leakage deduction rests on a thin 'deemed negligible' justification, and multiple key MRV parameters remain unreported.
Red Flags
- Lifetime ex-ante ERR differs by a factor of 7.6 between two verification reports dated 2024-06-13 (5,139,342 tCO₂e) and 2024-06-17 (676,317 tCO₂e), a discrepancy the VVB itself flagged as making ERR accuracy unclear
- A Forward Action Request was raised regarding double-counting risk across multiple TIST projects in Uganda, with a corrective action requiring a standardized data management system to prevent dual issuance
- Verified ERR of 720,666 tCO₂e over ~17.3 years represents approximately 370% of the pro-rata expectation derived from the more recent ex-ante lifetime figure of 676,317 tCO₂e over a 60-year crediting period, raising over-crediting concerns
- 16 corrective actions remain open, including KML file inconsistencies, incorrect tool versions, and unclear financial viability justification in the non-permanence risk report
Credit Vintages
| Issued | Retired | Available | ||
|---|---|---|---|---|
| 2003 | 1,188 | 1,188 | 0 | |
| 2004 | 29,473 | 18,160 | 11,313 | |
| 2005 | 29,473 | 17,807 | 11,666 | |
| 2006 | 29,473 | 17,827 | 11,646 | |
| 2007 | 29,473 | 17,828 | 11,645 | |
| 2008 | 29,473 | 17,829 | 11,644 | |
| 2009 | 29,473 | 17,829 | 11,644 | |
| 2010 | 29,473 | 17,831 | 11,642 | |
| 2011 | 29,473 | 17,829 | 11,644 | |
| 2012 | 29,473 | 17,830 | 11,643 | |
| 2013 | 29,473 | 17,829 | 11,644 | |
| 2014 | 29,473 | 17,830 | 11,643 | |
| 2015 | 29,473 | 17,831 | 11,642 | |
| 2016 | 29,473 | 17,788 | 11,685 | |
| 2017 | 29,473 | 17,832 | 11,641 | |
| 2018 | 29,473 | 17,378 | 12,095 | |
| 2019 | 29,473 | 17,366 | 12,107 | |
| 2020 | 29,473 | 17,261 | 12,212 | |
| 2021 | 6,304 | 6,304 | 0 | |
| Total | 508,533 | 309,377 | 199,156 |
Risk Indicators
VVB-confirmed barrier test
10% buffer, no reversals, 10% risk rating
0% deduction, 'deemed negligible' only
Project-specific, no reassessment date stated
FPIC, grievance mechanism, safeguards documented
CORSIA/CCP not stated; FAR on TIST double counting
Where to buy
Marketplaces
+ Know where to buy this?
Listing multiple projects? Send us a CSV at [email protected].
⚑ Dispute this rating
Are you the project owner?
Metadata correction (free)
Name, country, marketplace or links incorrect? Let us know.
Does not modify the score.
[email protected] →Pipeline re-run with new documents
Have updated documentation not yet included? You can request a new run of the pipeline with the new inputs.
Submit Documents →Share this rating