300MW Hydropower Project By JHPL
#1149of 1935 in Renewable energy#594of 975 in India#767of 1339 in Verra (VCS)#898of 1287 in ACM0002
Audit Analysis
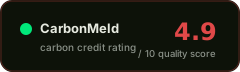
The 300 MW JHPL hydropower project is a registered VCS avoidance credit with VVB-confirmed additionality and no material findings, but the verification report (Nov 2024) required 17 corrective actions including meters not found at site, inconsistent emission factors, and calculation errors in project emissions. The project-specific baseline, unaddressed leakage justification, and absence of a buffer pool or permanence mechanism introduce moderate integrity and claim-safety risks. Multiple contradictions across verification reports (baseline method, grid emission factor, safeguards status) further reduce confidence in the data record.
Red Flags
- Meters reported in the monitoring report were not found installed at the site during the 2024 verification, raising serious MRV integrity concerns
- 17 corrective actions were required in the 2024 verification, including missing calibration certificates, PPAs, commissioning certificates, JMRs, and invoices for the full monitoring period
- Leakage deduction is 0% with the justification recorded as 'not addressed' in the 2024 verification report, a regression from the 2023 report which stated 'deemed negligible'
- Grid emission factor increased from 0.805 (2016 validation) to 0.9273 (2024 monitoring), a 15% increase that inflates baseline emissions and credit volume
- No buffer pool or permanence mechanism is documented for the 10-year crediting period, and reversal events are not addressed
Credit Vintages
| Issued | Retired | Available | ||
|---|---|---|---|---|
| 2007 | 564,563 | 243,861 | 320,702 | |
| 2008 | 962,794 | 639,722 | 323,072 | |
| 2009 | 730,575 | 675,316 | 55,259 | |
| 2010 | 934,488 | 806,844 | 127,644 | |
| 2011 | 1,002,913 | 506,601 | 496,312 | |
| 2012 | 983,907 | 982,163 | 1,744 | |
| 2013 | 909,989 | 784,989 | 125,000 | |
| 2014 | 1,000,442 | 1,000,442 | 0 | |
| 2015 | 1,047,495 | 1,047,495 | 0 | |
| 2016 | 1,218,642 | 1,162,572 | 56,070 | |
| 2017 | 786,634 | 667,626 | 119,008 | |
| 2018 | 1,167,362 | 1,151,181 | 16,181 | |
| 2019 | 1,256,820 | 20,002 | 1,236,818 | |
| 2020 | 1,216,454 | 38,800 | 1,177,654 | |
| 2021 | 1,188,832 | 8,615 | 1,180,217 | |
| 2022 | 1,256,982 | 0 | 1,256,982 | |
| 2023 | 1,079,354 | 0 | 1,079,354 | |
| 2024 | 693,362 | 4,368 | 688,994 | |
| Total | 18,001,608 | 9,740,597 | 8,261,011 |
Risk Indicators
VVB-confirmed barrier test
mixed evidence / unresolved risk
0% deduction, justification 'not addressed'
Project-specific baseline; method changed between reports
FPIC, grievance mechanism, and safeguards documented (2024)
CORSIA not eligible; CCP status not stated
Where to buy
Marketplaces
+ Know where to buy this?
Listing multiple projects? Send us a CSV at [email protected].
⚑ Dispute this rating
Are you the project owner?
Metadata correction (free)
Name, country, marketplace or links incorrect? Let us know.
Does not modify the score.
[email protected] →Pipeline re-run with new documents
Have updated documentation not yet included? You can request a new run of the pipeline with the new inputs.
Submit Documents →Share this rating